China's manufacturing PMI hit another four-month low in June
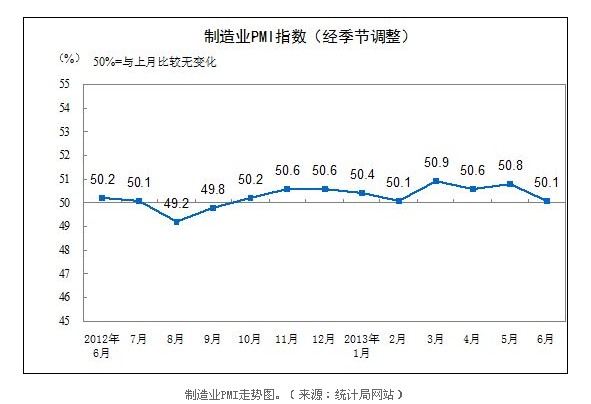 In response to the survey of manufacturing purchasing managers in June, special analyst Zhang Liqun said: "The PMI index fell in June, and the main indicators generally fell, indicating that the future economy has some downward pressure. But the absolute value of PMI is still above the 50% threshold; From January to May, the growth of investment and consumption was generally stable. Excluding the disturbance of hot money, the actual growth rate of exports did not fall sharply; the inventory level was historically low, and the space for further decline was limited. The effect of steady growth is still further manifested. Economic growth is still in the process of stabilization."
The new order index fell back. The new order index for this month was 50.4%, down 1.4 percentage points from the previous month. Among the surveyed enterprises, the proportion of new orders increased by 21.8% compared with last month, down 4 percentage points from the previous month; the proportion of enterprises that were flat compared with last month was 54%, a slight increase of 0.2 percentage points from the previous month; The proportion of companies that were reduced was 24.2%, an increase of 3.8 percentage points from the previous month.
The production index fell back. The production index for this month was 52.0%, down 1.3 percentage points from the previous month. Among the enterprises surveyed, the proportion of enterprises with an increase in production volume compared with the previous month was 24.3%, down 4.2 percentage points from the previous month; the proportion of enterprises that were flat compared with the previous month was 53.2%, which was the same as that of the previous month; 22.5%, an increase of 4.2 percentage points from the previous month.
The raw material inventory index fell slightly. The raw material inventory index for this month was 47.4%, down 0.2 percentage points from the previous month. Among the surveyed enterprises, the proportion of enterprises with increased raw material inventory increased by 12.5% ​​from the previous month, down 1 percentage point from the previous month; the proportion of enterprises that were flat compared with last month was 67.4%, down 1.1 percentage points from the previous month; The proportion of enterprises was 20.1%, an increase of 2.1 percentage points from the previous month.
The decline in the employee index has slowed down. The employee index for this month was 48.7%, down 0.1 percentage points from the previous month. Among the enterprises surveyed, the proportion of employees increased from the previous month was 5.0%, down 1.4 percentage points from the previous month; the proportion of enterprises that were flat compared with last month was 86.8%, up 1.8 percentage points from the previous month; The proportion of enterprises was 8.2%, down 0.5 percentage points from the previous month.
The purchase price index fell slightly at a low level. The purchase price index for this month was 44.6%, down 0.5 percentage points from the previous month. Among the surveyed enterprises, the proportion of enterprises whose purchase price increased from last month was 7.2%, down 0.1 percentage points from the previous month; the proportion of enterprises that were flat compared with last month was 74.6%, which was the same as last month; It was 18.2%, up 0.1 percentage point from the previous month.
In June, the company reflected that the proportion of enterprises reflecting insufficient orders was 47.0%, up 4.3 percentage points from the previous month; the proportion of enterprises reflecting rising labor costs was 45.4%, up 0.1 percentage points from the previous month; and the proportion of enterprises reflecting the tight capital was 40.9%. The chain increased by 1.5 percentage points; the proportion of enterprises reflecting the appreciation of the renminbi was 13.6%, up by 0.9 percentage points from the previous month. The proportion of enterprises reflecting the rise in raw material prices was 16.7%, down 1.3 percentage points from the previous month; the proportion of enterprises reflecting the increase in transportation costs was 26.5%, down 1 percentage point from the previous month.
Manufacturing Purchasing Manager Survey Description
1. Explanation of main indicators
The Purchasing Managers' Index (PMI) is an index compiled from the monthly survey results of the company's purchasing managers. It covers all aspects of enterprise procurement, production, and circulation. It is the first international monitoring trend for macroeconomic trends. One of the sex indexes has a strong predictive and early warning effect. PMI usually takes 50% as the cut-off point of economic strength. When PMI is higher than 50%, it reflects the expansion of manufacturing economy; below 50% reflects the contraction of manufacturing economy.
2. Scope of investigation
It covers 31 major industries in the manufacturing sector of the National Economic Industry Classification (GB/T4754-2011). Since January 2013, the survey sample has expanded from 820 to 3,000.
3. Survey method
The manufacturing purchasing manager survey adopts the PPS (Probability Proportional to Size) sampling method, which is based on the major categories of the manufacturing industry. The sample size of the industry is allocated according to the added value of the added value of the manufacturing industry. The sample use in the layer and the main business of the enterprise. The probability of business income is proportional to the extraction.
The survey was organized and implemented by the investigation team directly under the National Bureau of Statistics. The national statistical network direct reporting system was used to conduct a monthly questionnaire survey on the enterprise procurement manager.
4. Calculation method
The manufacturing purchasing manager questionnaire covers production volume, new orders, export orders, existing orders, finished goods inventory, purchase volume, imports, purchase prices, raw material inventory, employees, supplier delivery time, production and operation activity expectations, etc. 12 Questions. The diffusion index is calculated separately for each question, which is the percentage of the number of companies that are responding positively plus half of the percentage of the answer.
PMI is a composite index calculated by weighting five diffusion indices (classification indices). The five sub-indices and their weights are based on their prior impact on the economy. Specifically, it includes: new order index, weight is 30%; production index, weight is 25%; employee index, weight is 20%; supplier delivery time index, weight is 15%; raw material inventory index, weight It is 10%. Among them, the supplier delivery time index is the inverse index, and the inverse operation is performed when synthesizing the PMI composite index.
5. Seasonal adjustment
The Purchasing Manager Survey is a monthly survey that is subject to seasonal fluctuations and data fluctuations. The PMI composite index and each sub-index released today are seasonally adjusted data.